An Agent in Every Pipeline
How definity’s unique agent-based architecture redefines data pipeline observability, offering seamless integration, real-time insights, and unmatched coverage for data engineering teams.

As a data engineer, you have a lot of moving pieces and points of failure to stay on top of. Stale and missing data, schema changes and inconsistent data, increased processing times and breached SLAs, runs that don’t start on time or never finish, unexplainable failures and infrastructure instability, query inefficiencies, and the list goes on and on… The risk of missing any one of these? Impact to downstream users and potentially a business loss and a loss of trust.
Comprehensively observing all these moving pieces – pipelines and data in action – is not an easy task. You need to build coverage of every pipeline and dataset on the platform. You need deep internal visibility to data and pipeline operation. You need to track these moving pieces in-motion. And you need to be able to react in real-time.
This is especially true in Spark and on-prem/hybrid environments where workloads are more complex with multiple intermediate steps, computation is distributed, and modern tooling is often lacking.
So what are your options? Integrate an external monitoring tool with your data warehouse and other components (outside-in), use the native Spark UI, or implement dedicated code (e.g., Spark listeners) in every pipeline. But these existing approaches all fall short as they either require significant implementation to achieve ubiquitous coverage, take a ‘black box’ monitoring approach looking only at outputs, are overly simplified or too granular to extract meaningful insights, and/or run after the fact (at-rest) and are unable to proactively remediate.
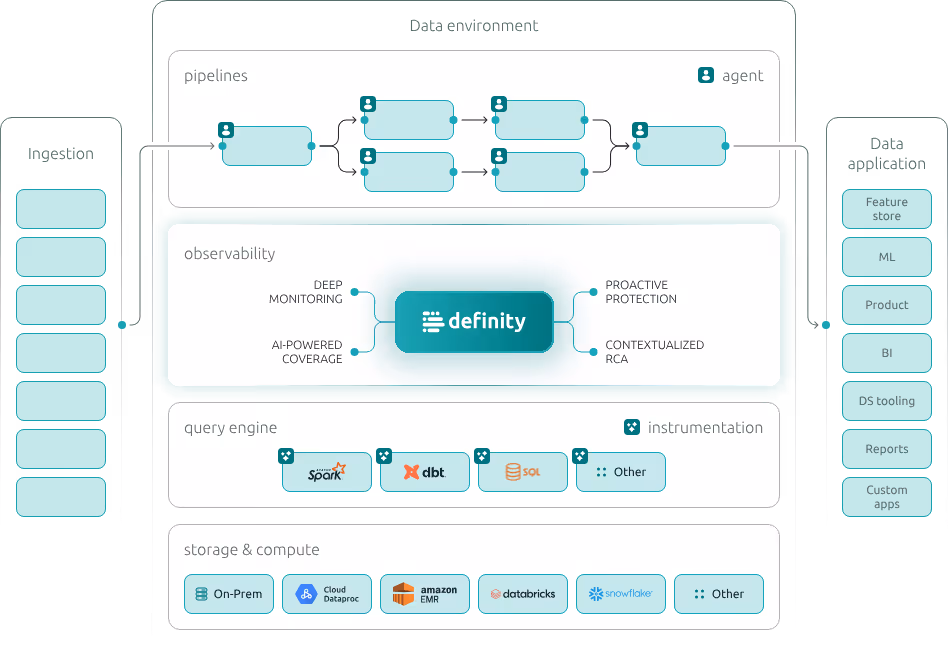
definity is taking a completely new and unique approach to data pipeline observability, with an agent-based architecture to address these key shortfalls. Here’s how our agents work and why we think they are the answer to the chronic lack of visibility in data engineering.
How does it work?
The definity agents are instrumented at the query engine level and live within pipelines, i.e., the code that the query engine executes.
The agents are instrumented centrally, one-time, by adding just a few configuration parameters to your central query engine instrumentation (e.g,. Spark Submit or DBT Run). For example, in Spark, all you need to do is:
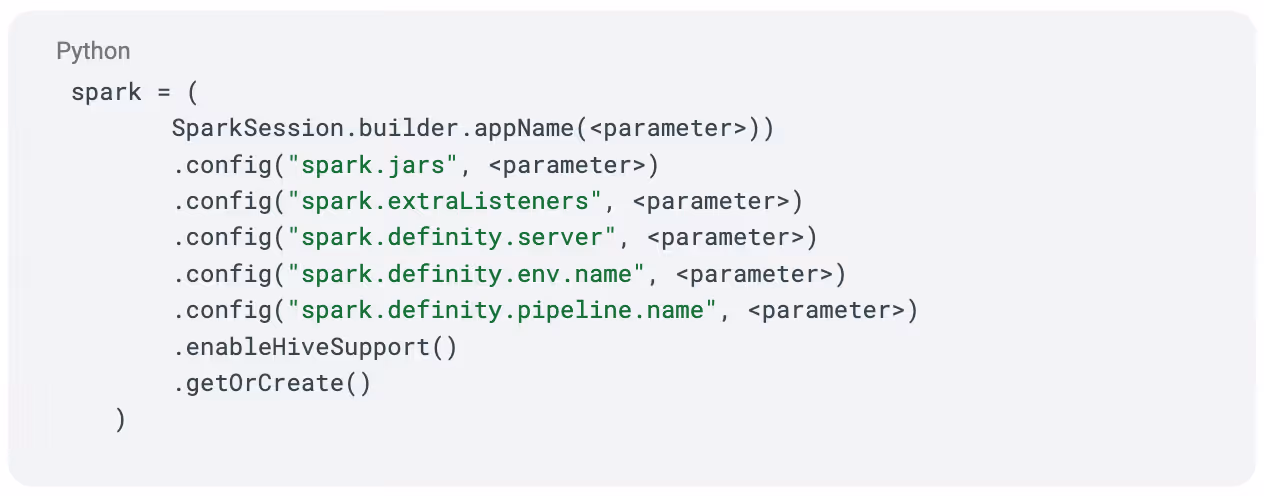
From that point, the agents seamlessly run within every pipeline on the platform (current or future).
The agent runs as part of the pipeline driver. For example, in a Spark environment it will look something like:
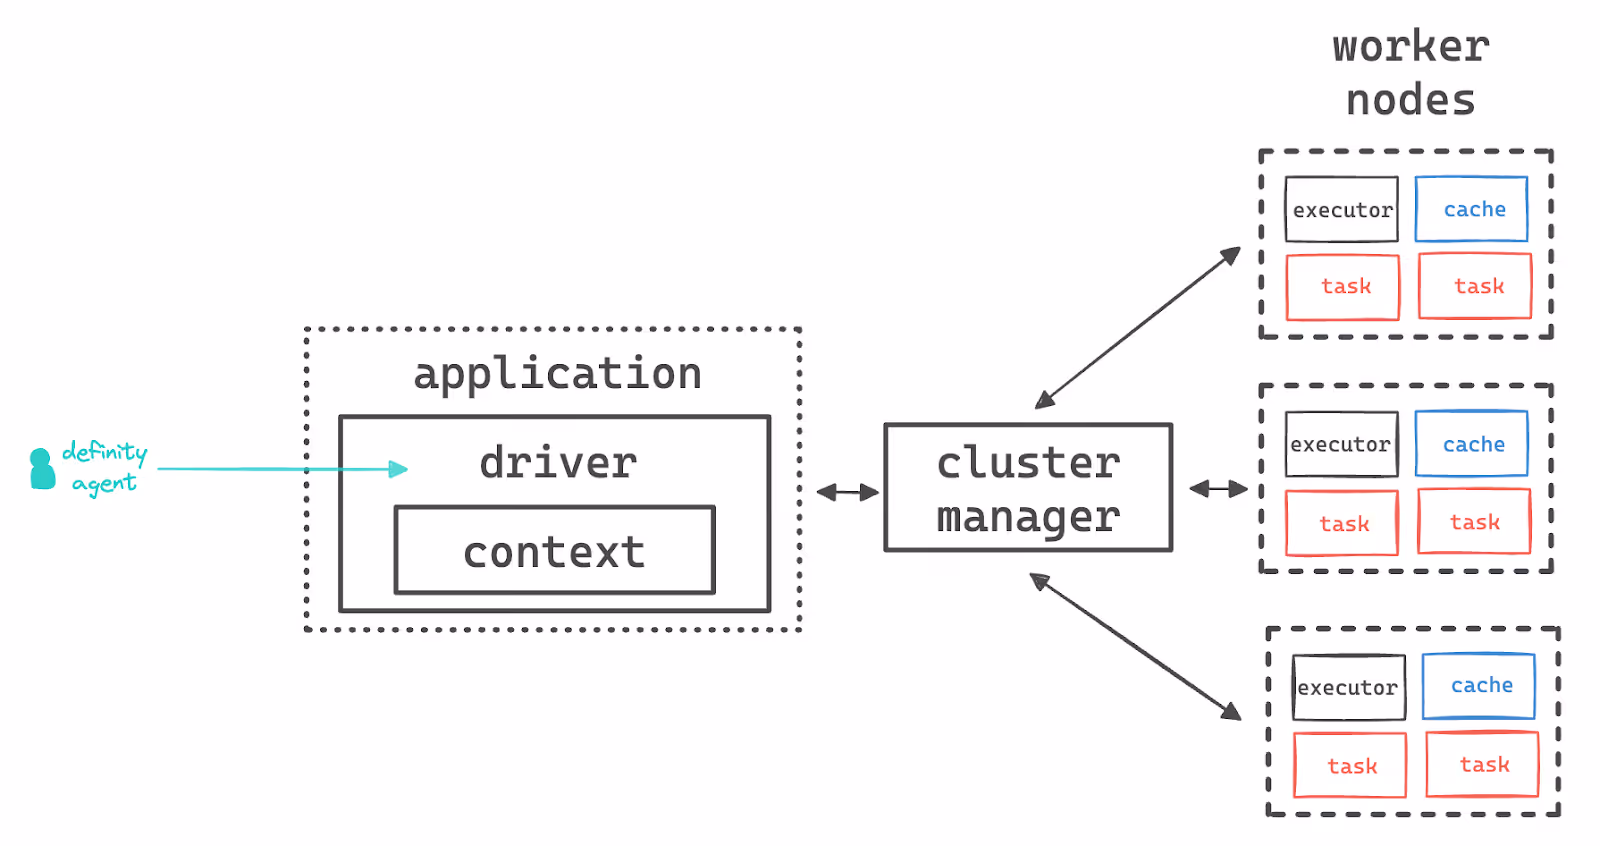
The Spark Driver contains the Spark Context, responsible for coordinating with the Cluster Manager and distributing tasks to the Worker Nodes. As the definity agents sit above the Spark Context and Worker Nodes, they see every task and worker node.
The agents see the real time execution plan, every data read and write, and any metadata from both datasets, execution, and the underlying infrastructure. They can also collect additional data, perform analytics on the fly, and configure and direct the pipeline operation (change the execution plan).
While running in the driver context, the agents run with zero/negligible footprint or impact on performance.
With agents running within each pipeline context, we can establish 100% visibility into data and pipelines in-motion, and can even control the pipeline – seamlessly, with zero upfront integration or code changes.
What capabilities does it enable?
So what can data engineering and platform teams do with an agent in the pipeline driver?
Instrument seamlessly across every pipeline
Traditional data monitoring tools typically involve significant integration effort upfront, requiring direct integration with multiple components across the data platform (e.g., data warehouses, lakeshouses, and orchestrators). It's no wonder that the "integrations" webpage for data monitoring tools is often a never-ending list. They also involve significant ongoing effort, requiring connectors maintenance and constantly onboarding new data assets (e.g., schema, jobs) individually. This typically results in heavy ongoing effort to scale and incomplete coverage.
Internally built monitoring tools often require data engineers to develop/add code to each pipeline, as well as implement exactly what to collect, test, and monitor, in order to leverage some centralized aggregation or reporting capabilities. This typically leads to lower adoption by engineers, low coverage, and lack of standardization.
Our agent-based architecture reinvents the way data teams can instrument observability:
- Central, one-time instrumentation, with zero code changes: instrument observability across the entire platform with just a few config parameters, and avoid upfront development and multiple integrations with multiple components.
- Auto-scaling coverage: seamlessly establish coverage over every asset on the platform, and avoid eliminating the effort to actively onboarding each pipeline or dataset and any future gaps and blind spots.
The benefits?
- Simplify the instrumentation process, reducing upfront integration and ongoing onboarding efforts
- Drive end-to-end coverage and stop worrying about scaling and user adoption
- Centralize & control capabilities serving, standardizing capabilities & practices
- Provide seamless capabilities to data developers, with zero effort or barrier for adoption
That’s it. With a single-point, one-time installation, you get complete, continuous coverage.
Gain inside-out visibility to data, pipelines, and infra
Traditional data monitoring takes an outside-in approach to observability. It is architectured to integrate externally to the data warehouse (and other components on the platform), check its content at certain intervals, and parse its audit logs. As such, it sees the data output but cannot see the pipeline internals and cannot couple the data with the specific execution that generated or consumed it.
definity takes a new inside-out approach to observability. The definity agents run within the pipeline execution context and see everything, providing unprecedented visibility. Running in the driver, they see the actual query engine's execution plan, observe every read/write operation and every input/interim/output data asset, and track materialized views and deep metrics.
This means that definity can monitor all aspects of data quality, pipeline code & execution health, and the underlying infrastructure performance, including:
- Data freshness, volume, distribution, and schema
- Input data quality
- Pipeline structure at all levels
- Pipeline runs’ health, durations & SLAs, failures, and re-runs
- Code & environment changes
- Resources consumption, CPU & memory utilization, spill, and dead-zones
- And more
It also means that definity has unique understanding of the context within which is data is read and written, and can automatically build deep data+job lineage, across pipelines and within each pipeline, to the most granular levels. Providing a rich contextualized execution view simplifies understanding of the data and pipeline behavior and accelerates root-cause and impact analysis when issues occur.
This fundamental difference is key to solving traditional monitoring ”black box problem”.
Run inline with pipeline execution
The other big setback of traditional data monitoring is that it sees the data output at-rest, AFTER it was generated.
definity’s agent-based architecture is changing the game with an in-motion observability, running INLINE within the pipeline execution, which provides several run-time capabilities:
- Detect anomalies in run-time, not after the fact or “near real-time”, allowing for the earliest possible alerts and mitigations
- Detect anomalies on input data (before pipelines even run!) and at each pipeline step (sub-task and interim tables), saving wasted runs altogether, stopping propagation downstream, and pinpointing issues to exact location they originated
- Monitor and check data efficiently on the fly, collecting low-touch metadata with negligible overhead, avoiding inefficient processes running separately (asynchronously) after the fact
This last benefit is particularly meaningful for on-prem teams that bear all the computational resources internally, and can result in substantial savings. For example, definity helped an enterprise customer reduce almost 15% in infrastructure costs by adopting agent-based observability, compared to their hometown asynchronous data validation infrastructure.
Auto-control, remediation, and optimization
Lastly, agents transform data engineering remediation and optimization. Unlike solutions that operate at-rest (e.g., traditional data monitoring) or are “read only” (e.g., Spark listener), the definity agents run in the pipeline driver, in run-time, enabling data teams to control pipelines in real-time in several powerful ways, for example:
- Preempt runs automatically (no code changes), stopping issues before they spread, simplifying root-cause analysis, and avoiding inefficient runs/jobs to save costs and time
- Kill hanging jobs, based on real-time prolonged processing, to save infrastructure resources and avoid SLA breach
- Modify pipeline structure on the fly, for example automatically redirecting production outputs to a staging environment to seamlessly test release candidate on live data in CI, to ensure reliability and performance before deployment
- Dynamically optimize performance, adjusting configurations and resources allocation based on real-time behavior
- Enable auto-remediation and self-healing, automatically triggering and executing predefined corrective actions to accelerate issue resolution
Ubiquitous observability
Traditional monitoring approaches often fail to provide the ubiquitous observability required at high-scale and complex environments. Other approaches require high expertise and development effort. definity’s agent-based observability offers a paradigm shift and a robust solution by embedding agents directly within the query engines, unlocking ubiquity across the platform.
Want to learn more about how agents-based observability can help you increase coverage and take control of your pipelines? Reach out to us to see how it can transform your data pipeline monitoring and management.